
How reporting works in AerScheduler
One Reports page holds 19 built-in reports, your own Overview dashboard, and the emails that go out on a schedule. Four ideas explain the rest: report, category, saved view, and date basis.
For owners, admins, dispatchers and technicians
Reporting lives on one page in the web console: WebReports. That page holds 19 built-in reports, your own Overview dashboard, and the reports your school emails out on a schedule. Four ideas explain everything else: report, category, saved view, and date basis.
Everything reporting lives on one page#
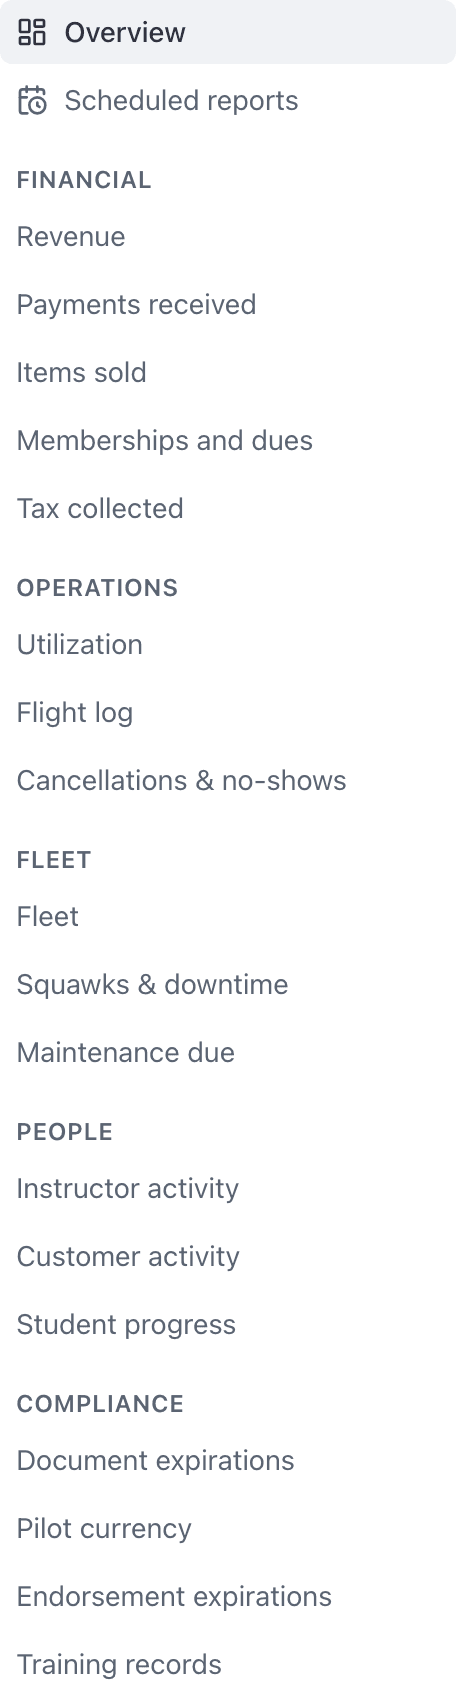
Open WebReports. A left rail lists everything that exists, and the pane beside it renders whichever item you pick.
The rail is always in the same order. Overview and Scheduled reports sit at the top on their own, then five category headings: Financial, Operations, Fleet, People, Compliance.
On a narrow screen the rail collapses into a "Choose a report" select at the top of the page. Nothing is missing, it just moves.
The 18 reports are fixed, saved views are yours#
There is no "new report" button, and you do not need one. Each of the 18 reports declares what its rows are, which columns exist, which filters it offers, and what it can be grouped by. You shape one of them, then save that shape as a view.
So the answer to "we need a report of X" is almost always: pick the nearest report, filter it, group it, choose the columns, save it. "Month-end revenue", "Lapsed students" and "Grounding squawks" are saved views, not separate reports. See Save a report as a view.
Everything else in this area runs those same 18 reports underneath: the dashboard tiles, the Needs attention counts, the scheduled emails, and the CSV exports. That is why a tile and the report you click into always show the same number.
Category decides who sees what#
Every report sits in one category, and the category is the whole permission model. Financial is owners and admins only. Dispatchers get Operations, Fleet, People and Compliance. Technicians get Fleet.
Reports you cannot run are absent, not greyed out. A dispatcher opening Reports sees no Financial heading at all, so there is nothing to click and no upgrade prompt to misread. Full detail is in Who can see which reports.
Date basis is why two reports disagree#
Under the date range picker on every report there is a small caption reading "by" and then a date. That caption tells you which date your range applies to.
It is the most load-bearing line on the page. Revenue is windowed on the date an invoice was raised. Payments received is windowed on the date it was paid. An invoice raised in June and paid in August is June's revenue and August's cash, so the two reports will not agree over the same window, and both are right.
The dashboard is yours, not the school's#
The board of tiles belongs to you alone. Everyone at the school gets their own, and changing yours changes nobody else's. It is the whole of the Dashboard page, and the same board is also Reports \u2192 Overview.
The default layout is fourteen tiles over Last 30 days versus the previous period: two widgets ("Up next" and "Needs attention"), four operations figures, four money figures, two trend charts, and two breakdowns by aircraft. Every figure opens the report behind it.
Move, resize, add and remove tiles.
What each count means and which one to work first.
Where else numbers show up in the console#
Reports is not the only place with figures on it, and the other places do not all come from the report engine.
| Where | What it is |
|---|---|
| WebReports | The 18 reports, Overview, and Scheduled reports. |
| A member's Activity tab | One person's hours, flights and spend over a window you pick. |
| An aircraft's Utilization tab | One tail's hours, flights and open squawks. |
| WebDashboard | The console home page: fleet and people counts, the next seven days, and for admins an Outstanding card. |
| WebOperations → Cancellations | A separate cancellations screen with its own filters and its own export. |
For one person or one tail, skip the reports entirely: see one student's hours or one aircraft's utilization.
Reporting on the iPhone#
There is no Reports section in the mobile app. Reporting is a web console feature, so use Webapp.aerscheduler.com on a laptop or an iPad browser.
A brand new school sees samples first#
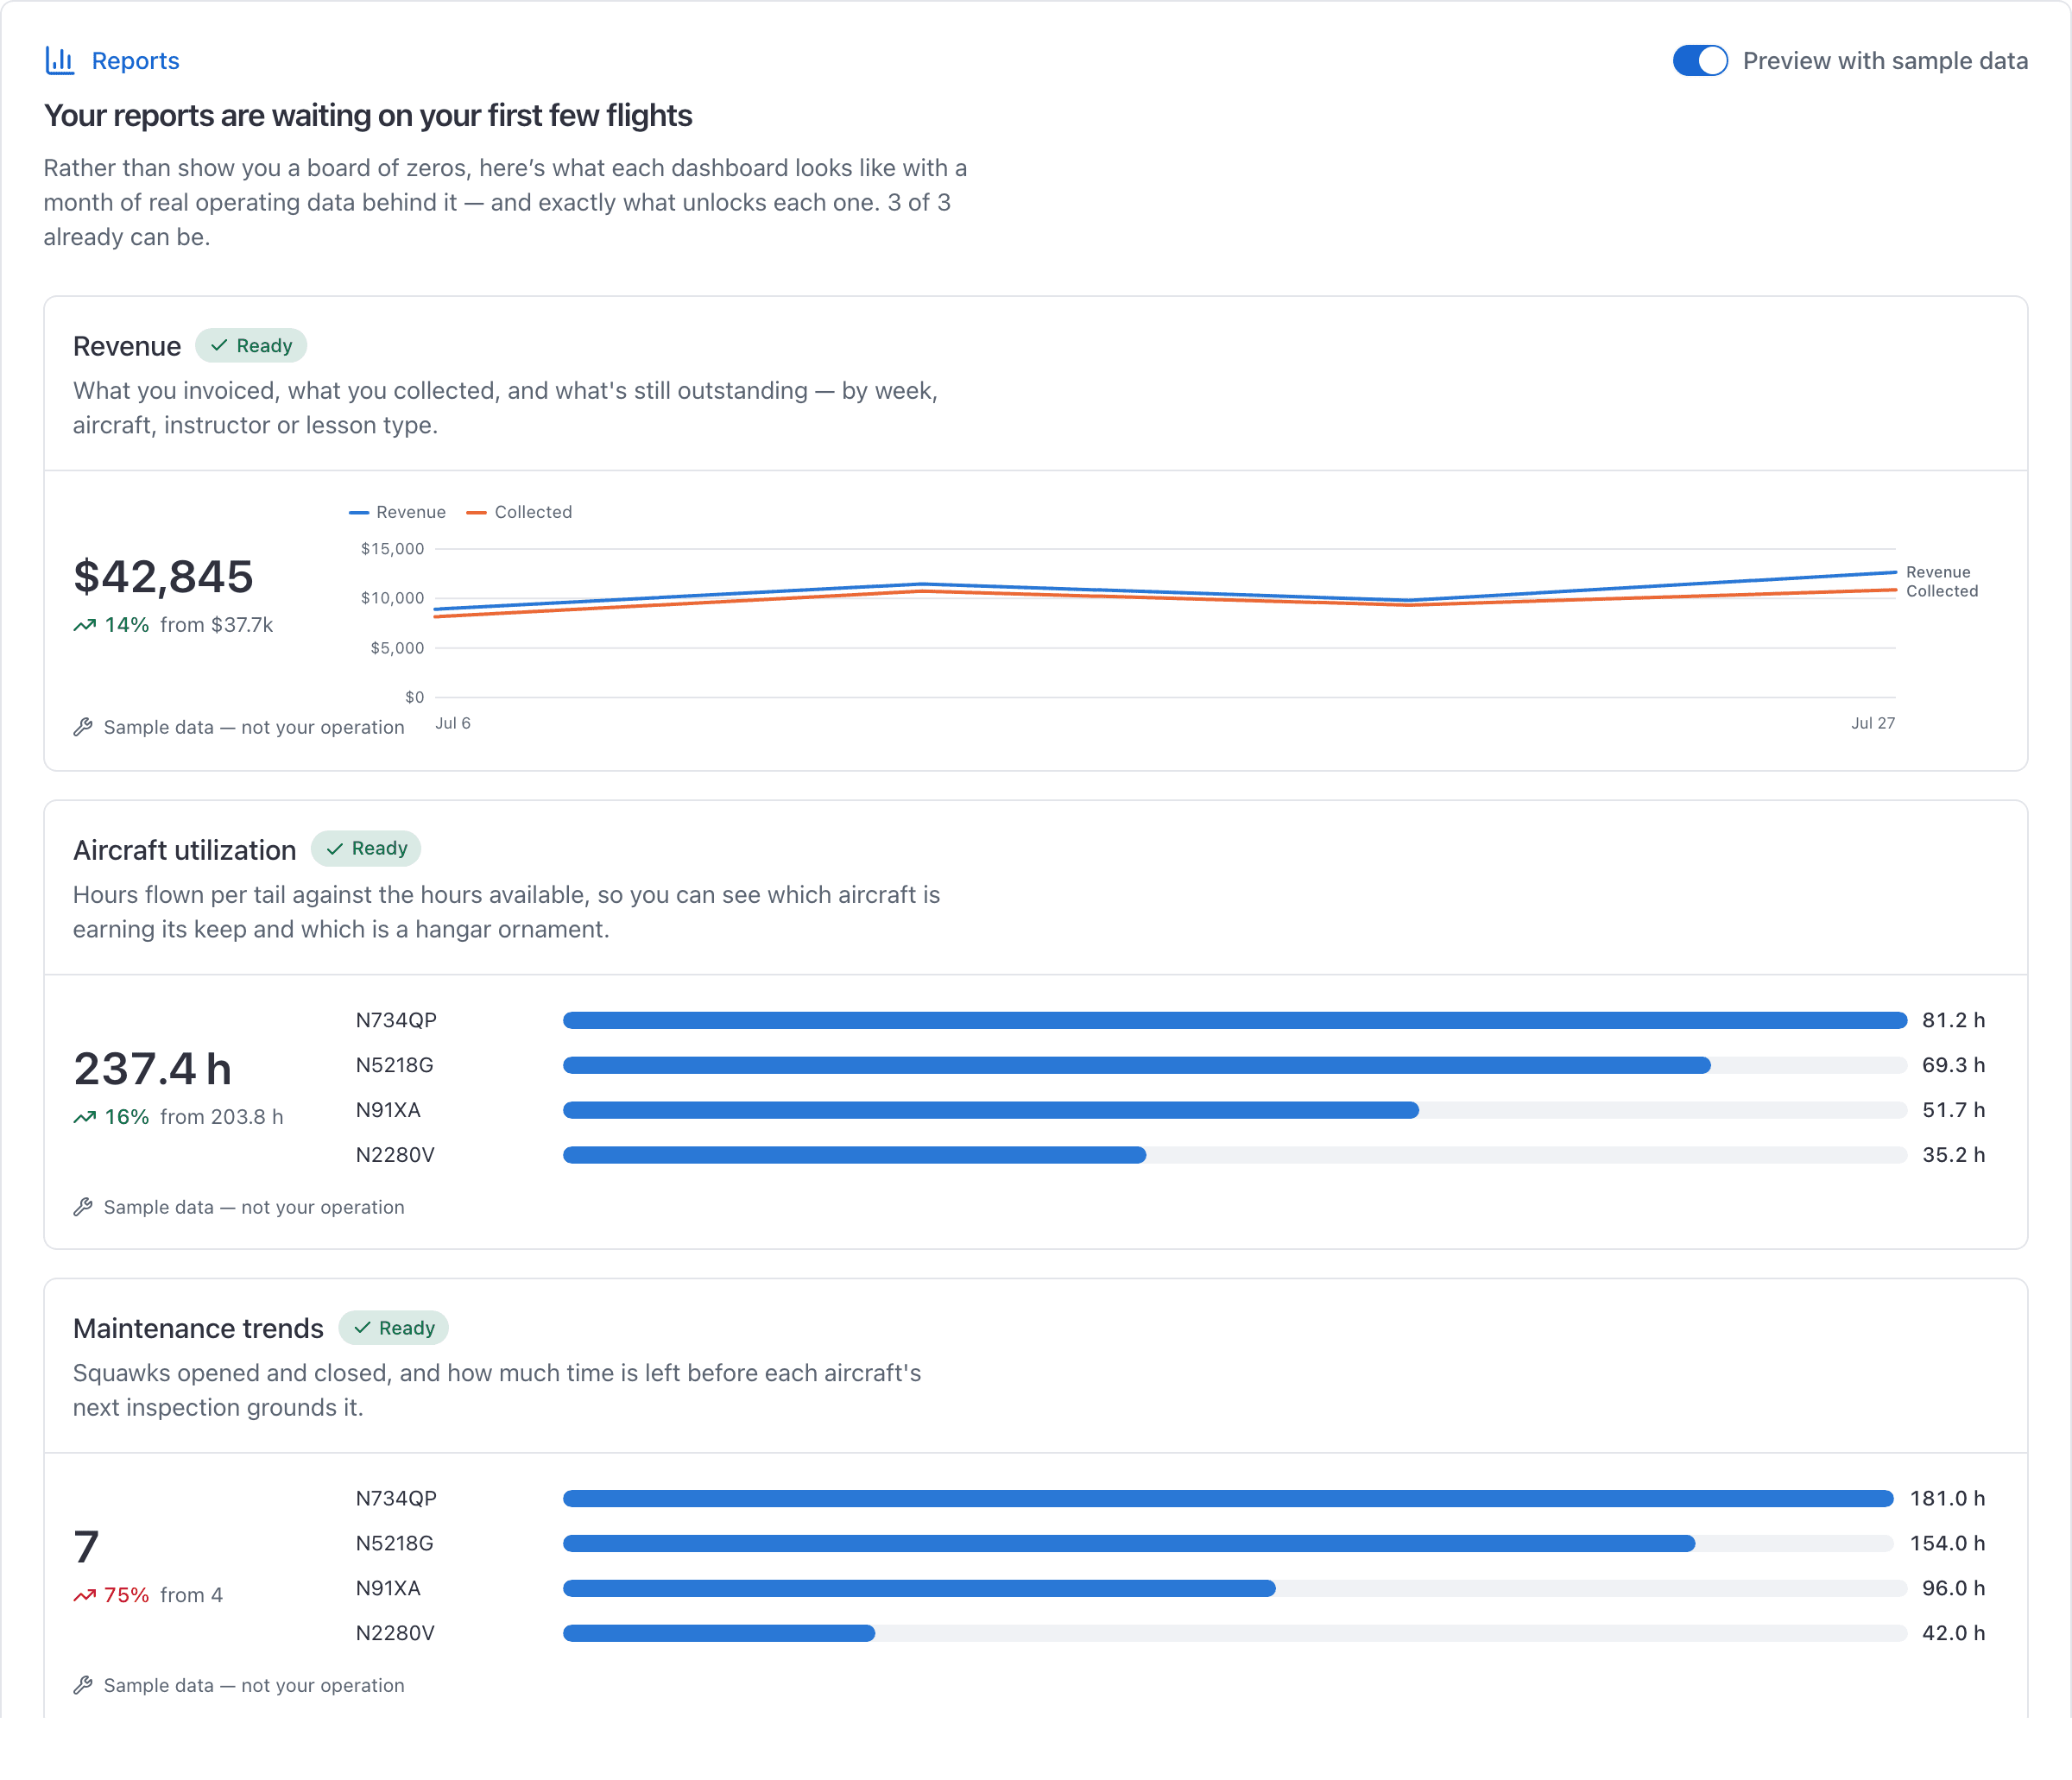
Until the school has 5 reservations or its first invoice, Reports shows a welcome screen instead: three preview cards titled "Revenue", "Aircraft utilization" and "Maintenance trends", each carrying either a green "Ready" chip or a grey lock chip naming what unlocks it ("Send your first invoice", "Schedule 5 reservations", "Add a maintenance reminder").
"Go to reports anyway" skips straight through to the real page.
Where to go next#
The toolbar, the date range, and the filter conditions.
All 18, the category each sits in, and the window it opens on.
Daily, weekly or monthly, to your team or your accountant.
Who did what, from which surface, and which fields moved.
Still stuck on this?
Email support@aerscheduler.com and tell us what you were trying to do. We answer.