
Group a report to rank aircraft, instructors, or students
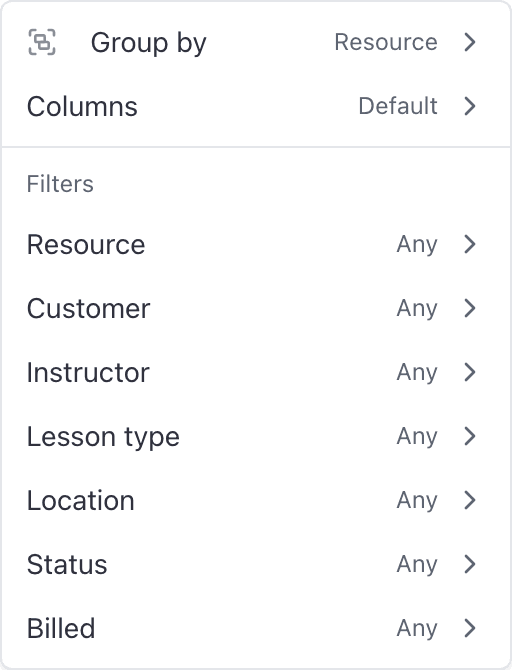
Group by collapses the rows into one line per aircraft, instructor, customer, or day, and adds a share bar so the ranking is obvious. It lives in the Filters menu, next to the column picker.
For owners, admins, dispatchers and technicians
Group by collapses a report's rows into one line per aircraft, instructor, customer or day, and adds a share bar so the ranking is obvious. It lives inside the Filters menu, next to the column picker.
Group by lives inside the Filters menu#
This is the single most common thing people cannot find. The button in the toolbar says "Filters", but the menu behind it holds three things: Group by at the top, Columns next to it, and then one submenu per filter field.
The badge on the button counts filters only, so grouping never shows up there.
Choose a dimension#
Open the report and click Filters
Set your date range first if you have not already.
Open Group by and pick a dimension
Each report offers its own list: resource, instructor, customer, day, reason, item, rate and so on.
Close the menu
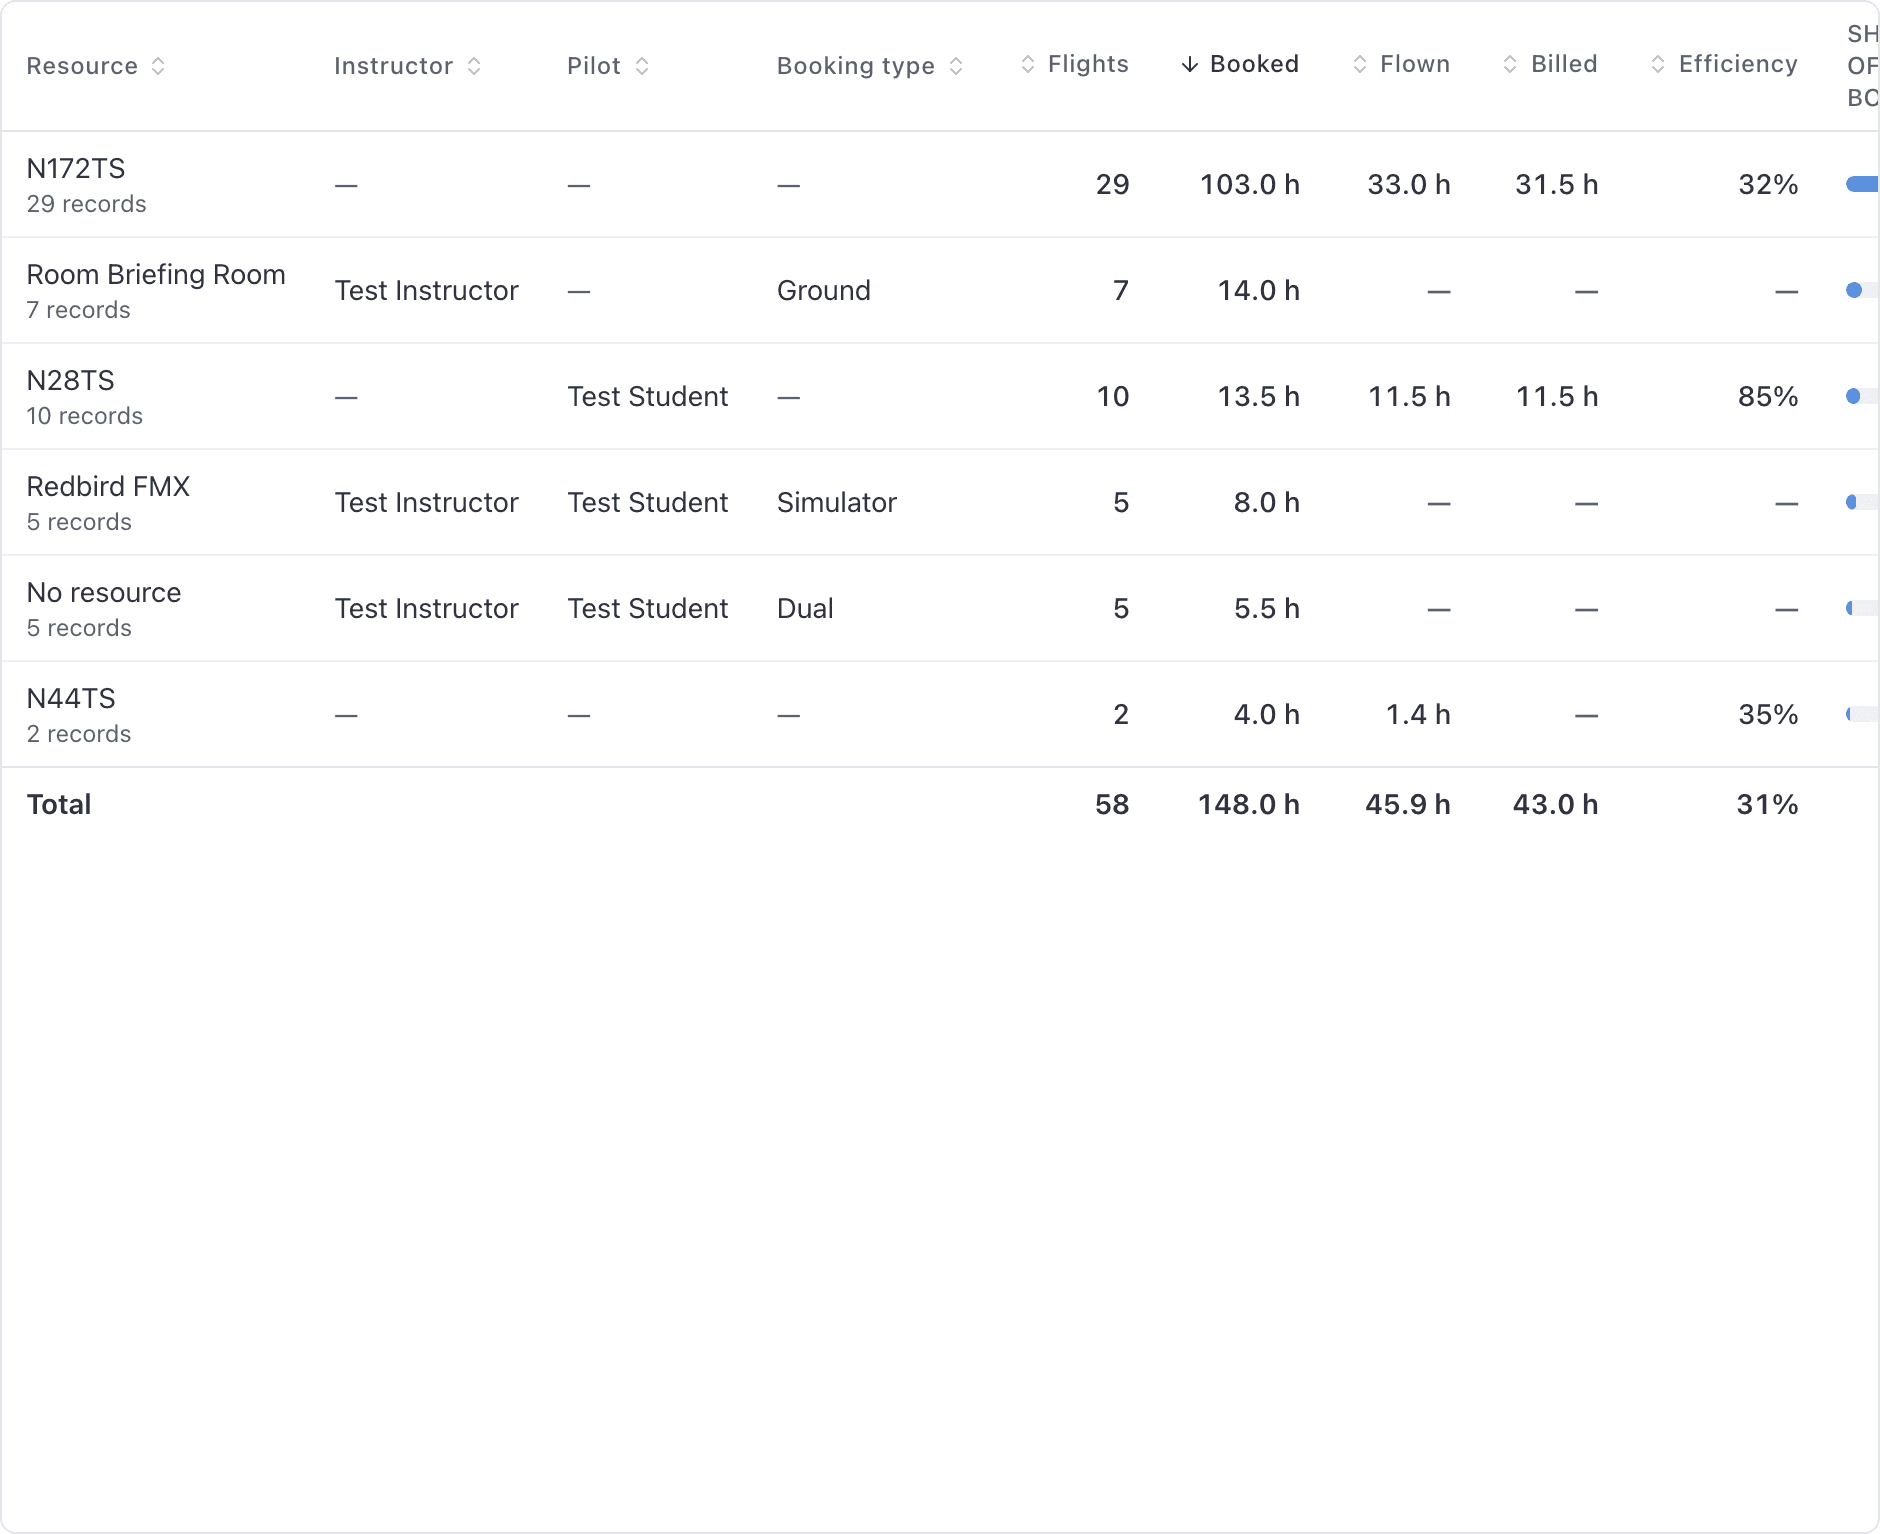
The table redraws immediately. The footer line changes from "n rows" to "n groups".
To go back, open Group by again and clear the selection.
Reading a grouped row#
A grouped row is one line per value of the dimension you picked, with every numeric column aggregated across the rows it swallowed. Under the group's name you get a small "n records" line telling you how many underlying rows sit behind it.
The Totals row at the bottom still covers every matching row across every page, not just the page on screen.
The Share of column#
When a report is grouped, a "Share of" bar column appears so you can see the ranking without doing the arithmetic.
It does not always appear, and that is deliberate. It needs the report to be grouped, to have more than one row, and for the measure to be non-zero somewhere. With a single group the share is trivially 100%, and if every value is zero every bar would draw at its minimum width and imply "negligible" about rows that are 100% of the data.
Reports that open already grouped#
Six reports open grouped, because ungrouped they answer the wrong question:
| Report | Opens grouped by |
|---|---|
| Revenue | Resource |
| Utilization | Resource |
| Items sold | Item |
| Tax collected | Rate |
| Cancellations & no-shows | Reason |
| Accounts receivable | Age |
Every other report opens ungrouped.
Percentages are recalculated, not averaged#
Ratio columns such as Efficiency (flown divided by booked) and Collected % (collected divided by billed) are re-computed from their two source columns at every level, including on the grouped row and the Totals row.
That is why the percentage always agrees with the two columns beside it. Averaging each row's own percentage would weight a 0.2 hour flight the same as a 4 hour one.
Choose which columns show#
The column picker is in the same menu.
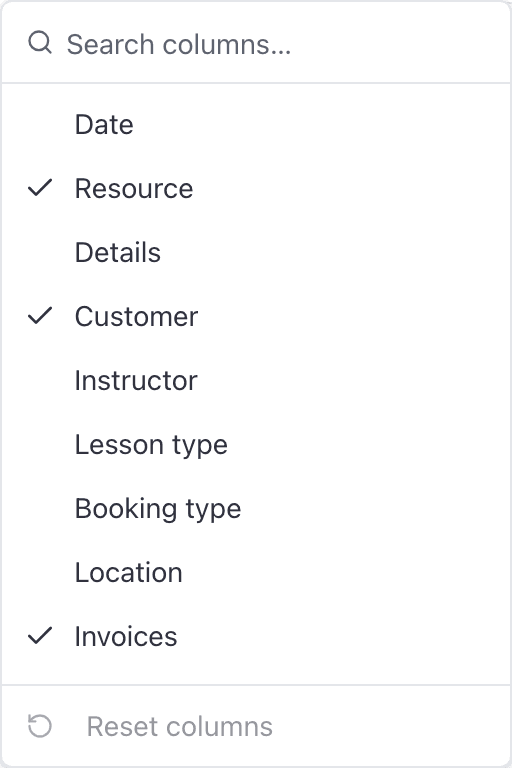
Click Filters, then Columns
The row reads "Default" when you have not changed anything, or "n of m" when you have.
Search or scroll, then tick and untick
There is a search box at the top of the submenu, which is faster than scrolling on a report with 19 columns.
Three things to know:
- Columns always appear in the report's own order, never the order you ticked them. Two people looking at the same saved view therefore see the same table.
- You cannot untick every column. The last one refuses to turn off.
- If you group by a column you have hidden, it is added back to the front of the table automatically.
Hovering a column heading shows its description where the report has one.
Reset the columns#
"Reset columns" at the bottom of the Columns submenu puts the report back to its own defaults. It does not touch your filters, your grouping or your date range.
What grouping changes#
| Changes | Does not change |
|---|---|
| One row per dimension value, with numbers aggregated | Which records match: filters and the date range still decide that |
| The footer reads "n groups" instead of "n rows" | The Totals row, which always covers every matching row |
| A "Share of" bar column appears | The date basis the window applies to |
| The CSV export, which exports the grouped table | Anything saved: nothing persists until you save a view |
Things that catch people out#
Next#
Keep the grouping, the filters and the columns.
Which reports exist and what each one opens on.
Still stuck on this?
Email support@aerscheduler.com and tell us what you were trying to do. We answer.